Renting your property has never been easier. Whether you're a first-time landlord or a seasoned investor, working with Elie means peace of mind and a streamlined process from start to finish. I handle everything from pricing to paperwork so you can focus on what matters most. For full details, check out this blog article - What It Means to List Your Property for Rent with Elie or follow the steps below to receive my Rental Service Guide directly to your inbox.
The Truth About Housing Affordability in Canada: Why the Headlines Aren’t Telling You Everything

Housing affordability is one of the biggest topics in Canada today — and for good reason. For many residents and newcomers, homeownership feels increasingly out of reach. Every day, we see headlines, reports, and politicians throwing around bold claims about the state of our housing market. But for how serious and important this conversation is, it deserves a lot more nuance than it currently gets.
It’s naive to think we can boil down the complexity of our economic and housing systems into a single, one-size-fits-all metric. And yet, that’s exactly what keeps happening.
So let’s unpack the core metric that everyone loves to quote: housing affordability.
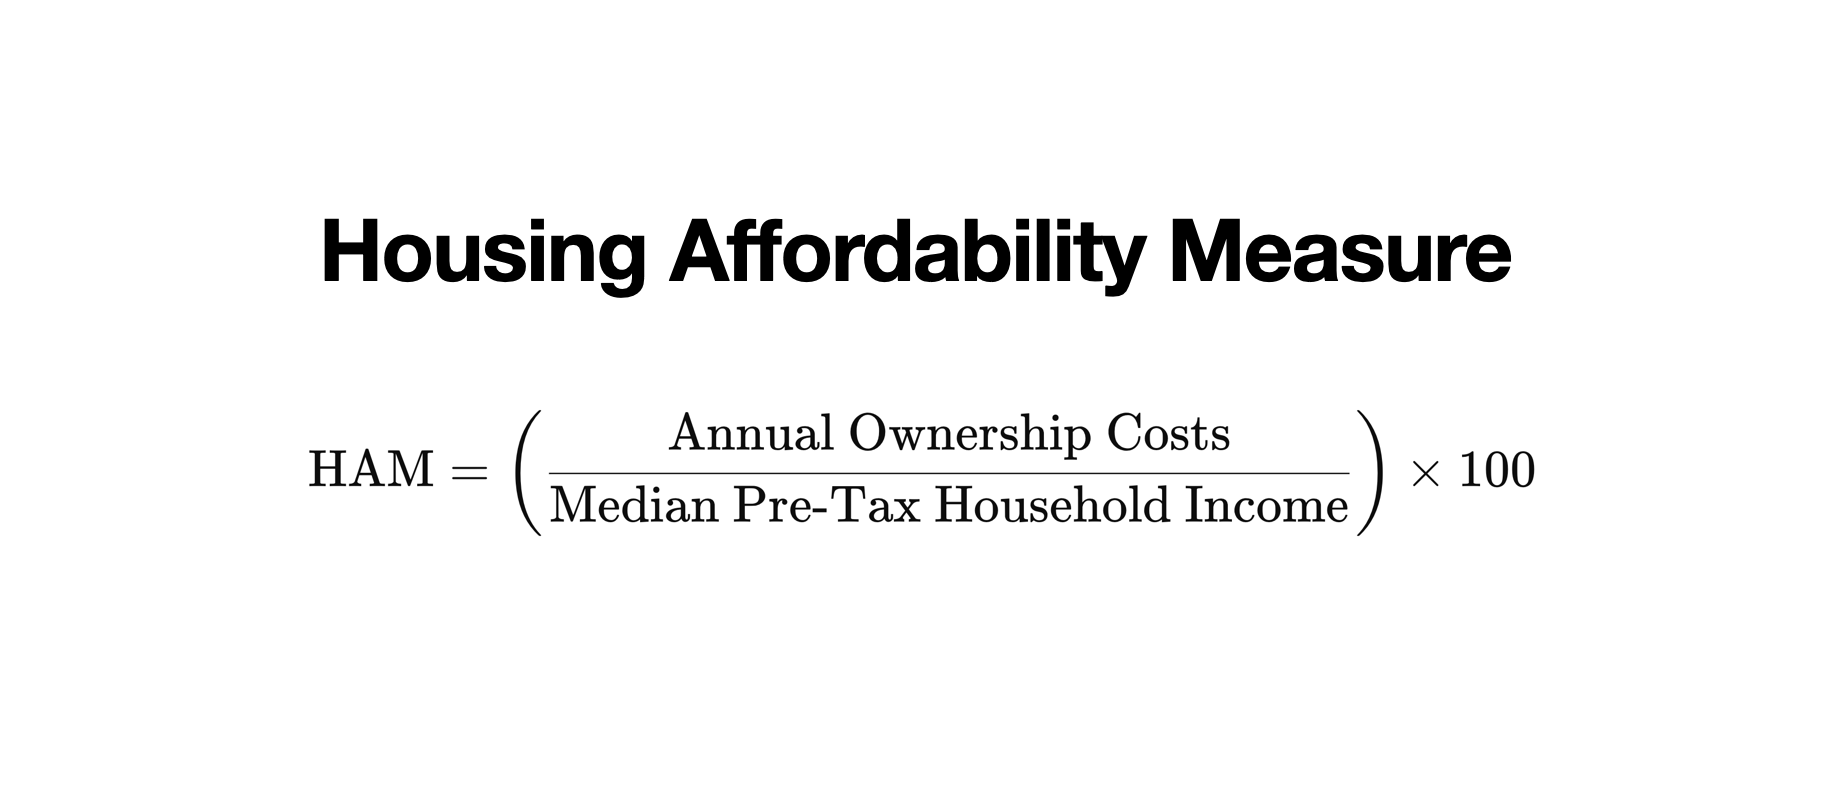
The Metric Everyone Cites — But Few Understand
In Canada, housing affordability is most commonly measured using the Home Price-to-Income ratio, or more specifically, the ratio of average home prices to median disposable income.
But another widely referenced approach comes from RBC Economics, which calculates housing affordability by determining the proportion of median pre-tax household income needed to cover ownership costs — including mortgage payments, property taxes, and utilities. In this blog post we will stick to the RBC Housing Affordability Measure (HAM) when referring to housing affordability.
Right now, in major cities like Toronto and Vancouver, that number exceeds 60–80% of pre-tax income — levels RBC itself describes as “extremely high.”
Sounds simple, right? But simplicity here is deceiving. Because when you dig into how these metrics are calculated, you’ll see the cracks — and they’re big enough to change the entire conversation.
Why CRA-Reported Income Is Not the Whole Story
Let’s take Toronto as an example. In some of the city's most affluent neighbourhoods — think Rosedale, Forest Hill, The Bridle Path — the average home sells for $4 to $6 million. But according to CRA and StatsCan data, the median household income in these areas is often reported around $120,000–$150,000. That doesn't add up.
Estimated HAM by Neighbourhood in Toronto
To learn more about the housing affordability metric, check out this blog post Housing Affordability Explained
2 key reasons why CRA income data gives a distorted view of reality:
1. Entrepreneurs Often Report Lower Incomes on Purpose
Many business owners, consultants, and independent professionals structure their finances in tax-efficient ways. This often means reporting lower personal income while reinvesting in their business or drawing from corporate accounts in non-taxable ways.
These individuals still live in high-end homes, vacation internationally, and pay for private school — yet none of that lifestyle is reflected in their CRA income.
2. Debt Is a Key Financial Tool for Wealthier Households
In today’s financial system, debt is not a sign of distress — it's a tool for leverage. Whether through Home Equity Lines of Credit (HELOCs), refinancing, or interest-only mortgages, affluent homeowners are able to tap into the equity in their homes to finance their lifestyles.
And none of this “liquidity” appears as income on their tax returns.
So if you're comparing average home prices to reported income — you're comparing real-time market prices to a filtered version of financial reality.
Debt Per Capita in Canada Is Soaring
To add even more weight to this argument, consider this: Canada now has one of the highest household debt-to-income ratios in the world.
According to the Bank of Canada, Canadian household debt now exceeds 180% of disposable income. That means for every $1 of after-tax income, Canadians owe $1.80.
This rise in debt is especially prominent in cities like Toronto and Vancouver, where home prices have outpaced income growth for decades.
So while affordability ratios may suggest housing is completely unaffordable — many Canadians are still buying homes. How? Through debt.

Example 1: The Incorporated Consultant (Using Dividends + Retained Earnings)
Profile: A self-employed consultant runs their business through a corporation and reports $100K in personal income through dividends.
Reality:
The corporation earns $400K annually but retains most of the profits within the company.
The consultant draws out just enough to maintain a modest personal income (lowering personal taxes).
Meanwhile, the corporation pays for a car, business travel, even part of the home office expenses.
The consultant secures a mortgage using stated income or net-worth lending, and buys a $2.5M home with a large down payment.
Living expenses are supplemented using a HELOC secured against the home or funds drawn from the corporation.
Result: Modest CRA income, low personal taxes, high actual cash flow.

The Multigenerational Household
Profile: A family reports $100K combined income across two adults.
Reality:
They purchased their home with the help of extended family (e.g., parents helping with down payment).
Parents co-sign on the mortgage or lend money interest-free.
The household’s living expenses are shared, lowering the per-person burden.
Home equity is tapped through a HELOC to renovate, invest, or fund a business.
Result: Ownership in a high-priced neighbourhood, low reported income, but solid family-backed financing.
What Does This Mean for You?
If you're a first-time buyer, immigrant, or simply trying to make sense of the market — don’t let national affordability ratios define your sense of possibility.
They’re based on averages, aggregates, and incomplete income data. They don’t reflect your unique financial situation, your potential for growth, or your long-term goals.
More importantly, they don’t account for the real drivers of purchasing power today: financial structuring, equity, and access to credit.
The Bottom Line
Housing affordability is complex, and that’s exactly why we need to stop oversimplifying it.
Yes, prices are high. Yes, income growth hasn’t kept pace. But the numbers we rely on to measure the gap? They’re based on flawed assumptions.
So before you let the headlines scare you — ask better questions. Look beyond the ratios. And if you need clarity tailored to your situation, connect with someone who understands how this system really works.
I'm here to help you do exactly that. Let’s connect and start the conversation early.